Visualization
Using Tableau, create visualization for each question in the report. You will work on this independently just like last week.
To include a Tableau visualization in your report, take a screenshot, save it as an image,
put it in the learning/week2 folder, and replace  with
your own image. Please makes sure your screenshot includes the entire Tableau interface
including the controls, widgets ...etc.
Import
Data: fcq.clean.json
(a copy of this file is in your book repository already in the directory hackathons/fcq)
This dataset is provided to you in the JSON format. Your first task is to figure out how to transform this JSON file into a format that can be fed into Tableau. As a junior and senior, you are expected to be able to look around the Internet to problem solve.
Question 1 [Zachary Lamb]: How does retention compare across departments?
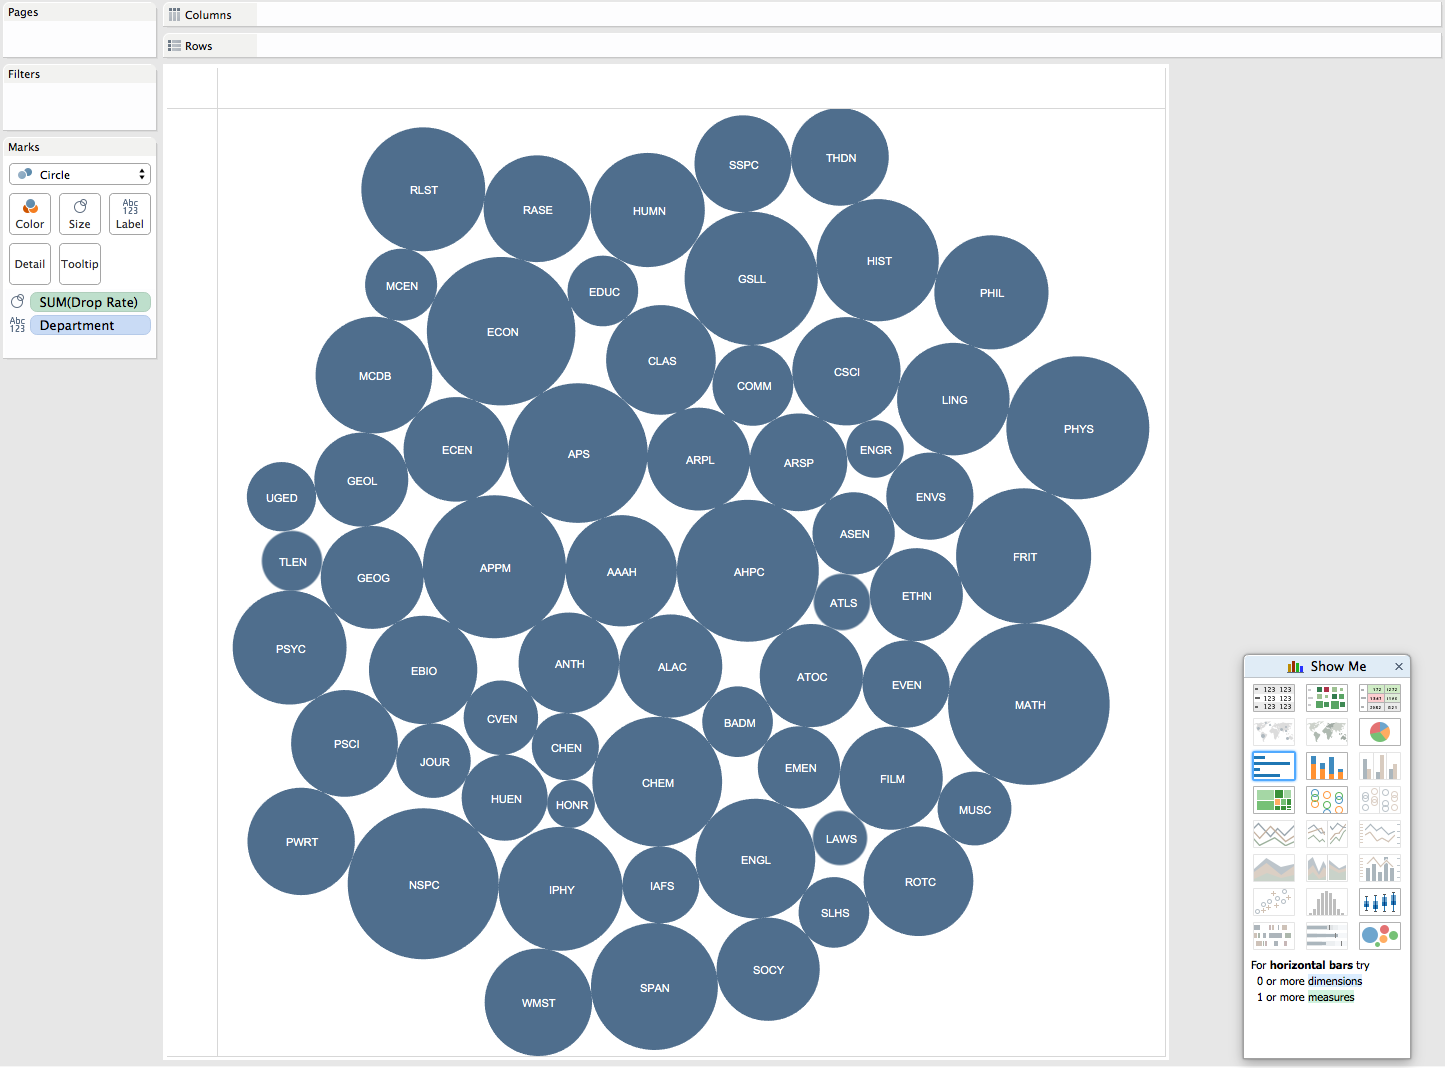 Figure 1-1: Academic Departmental withdrawal rate comparison
MATH and APPM both have larger than average withdrawal rates... interesting
Question 2 [Kevin Gifford]: What is the ranking of Departments within the College of Engineering & Applied Sciences based on averaged course rating and average instructor rating?
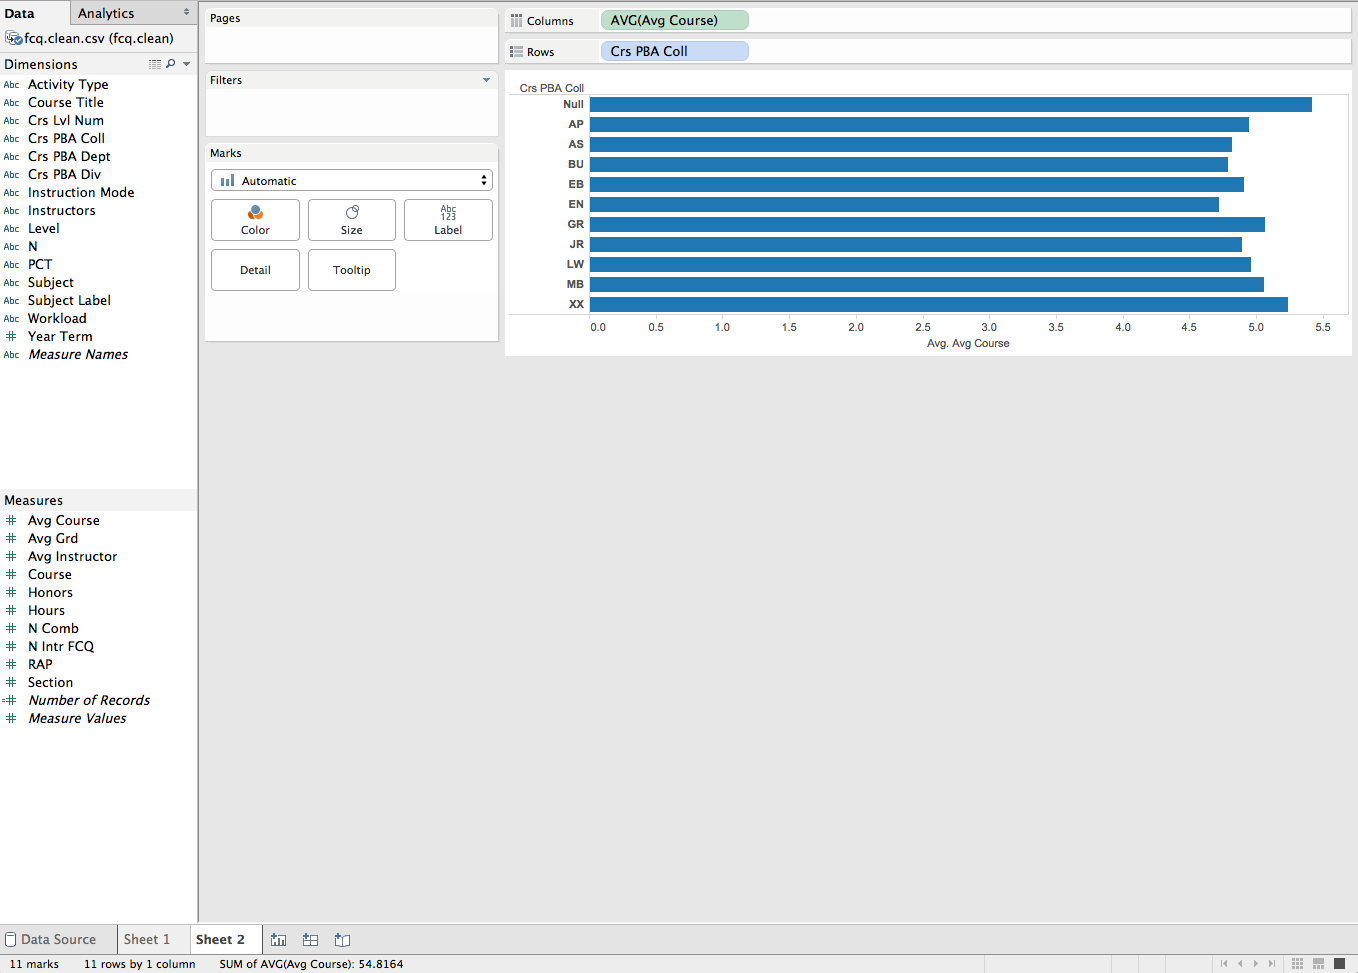 Figure 2-1: Average Course Rating for the various CU-Boulder colleges.
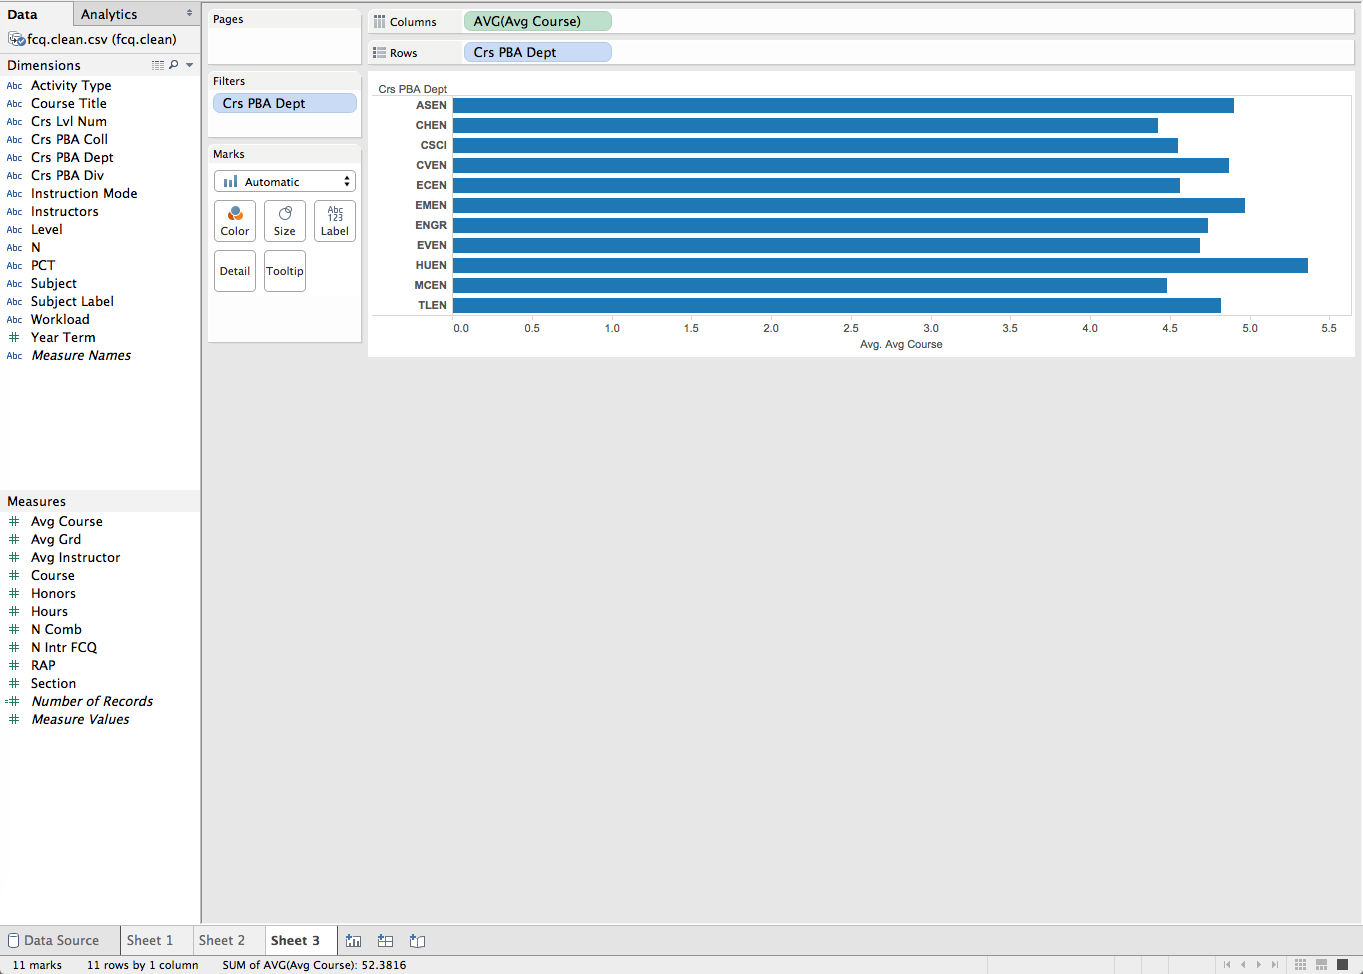 Figure 2-2: Average Course Rating each College of Engineering Department.
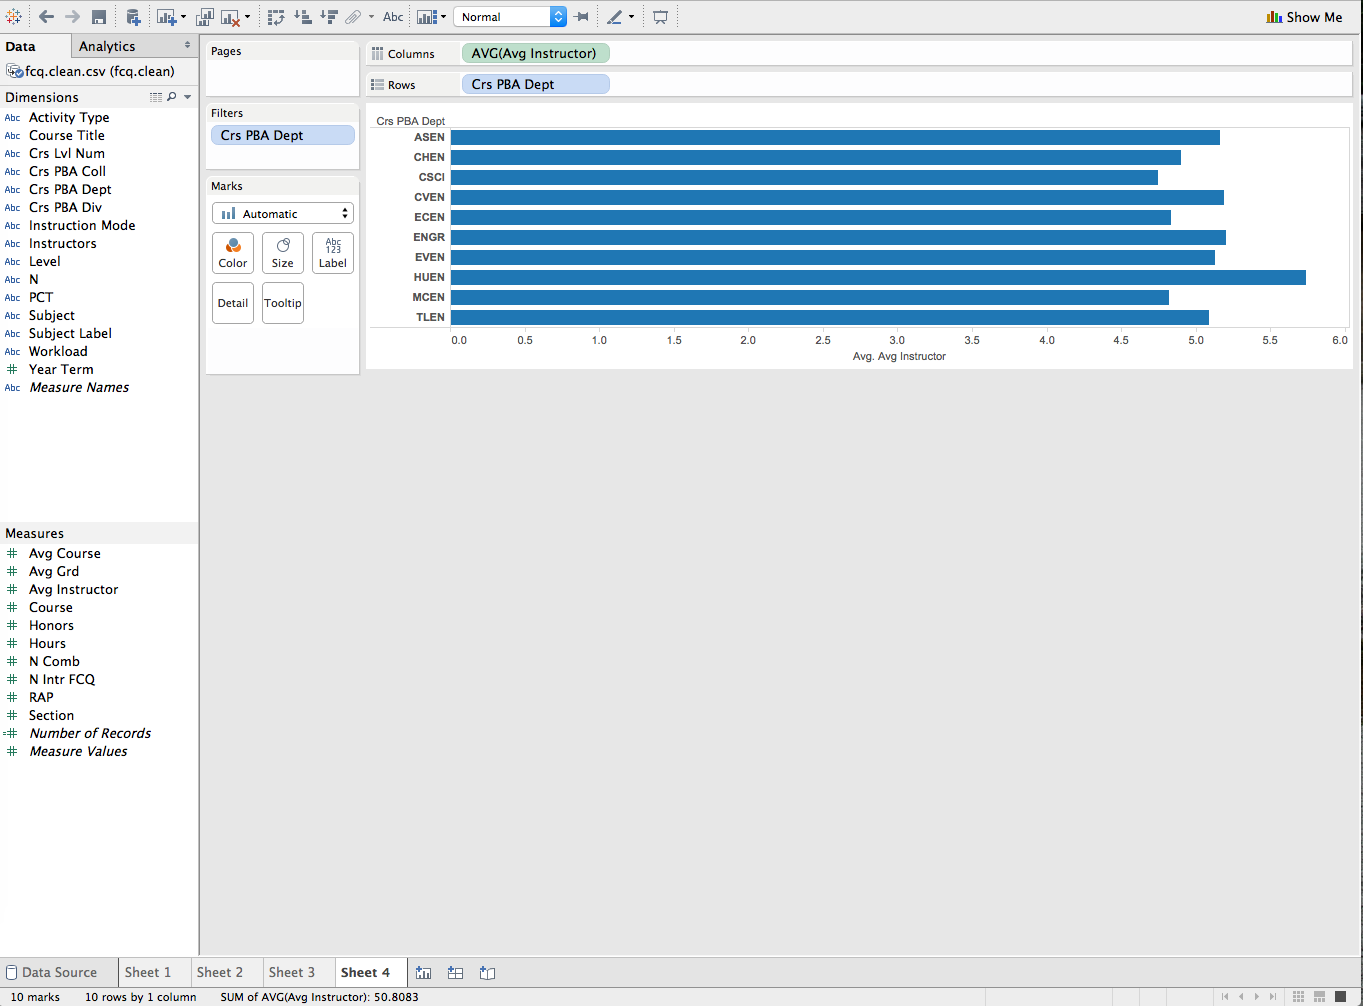 Figure 2-3: Average Instructor Rating each College of Engineering Department.
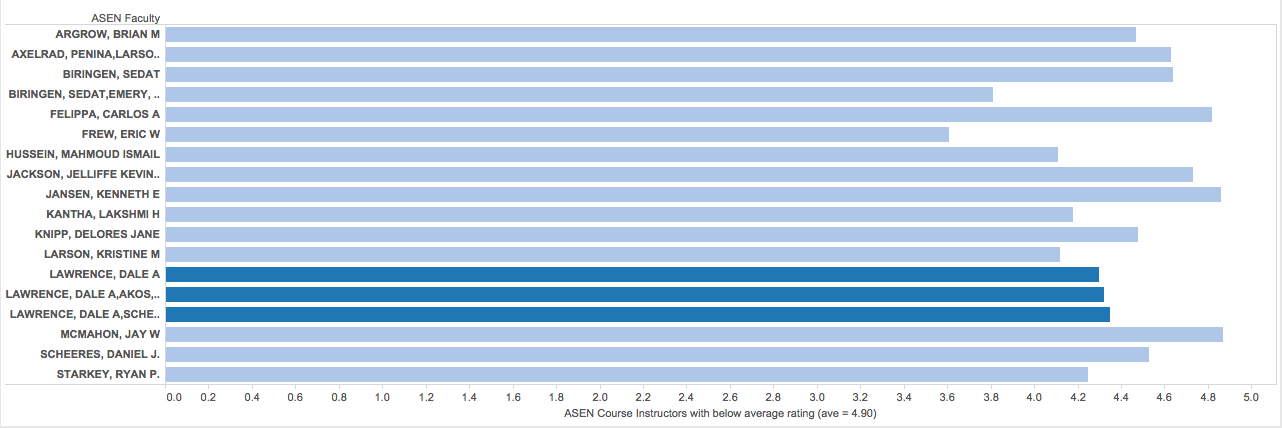 Figure 2-4: ASEN Instructors with below average Course (average = 4.90)
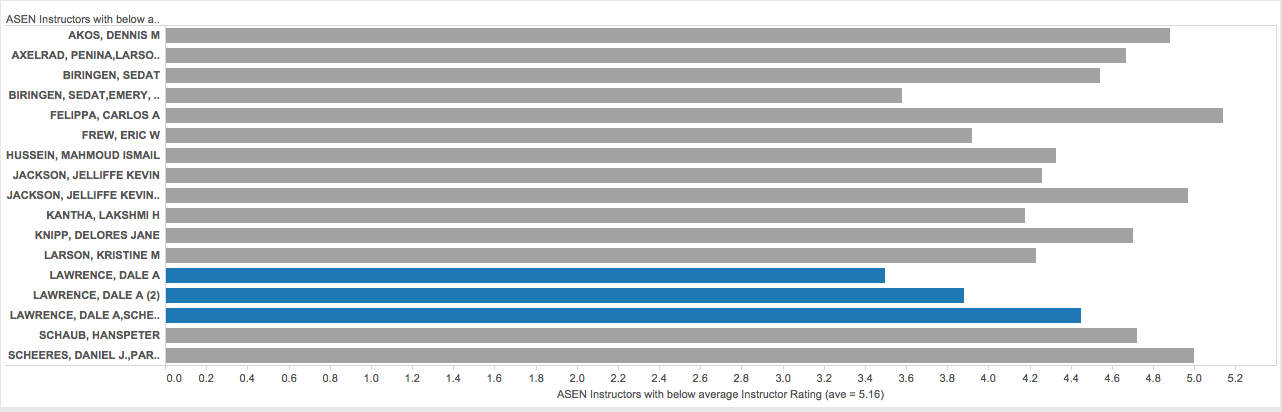 Figure 2-5: ASEN Instructors with below average Instructor (average = 5.16)
Question 3 [Karen Blakemore]: What is the distribution of instructor type (e.g., Lecturer, Assistant Professor, Instructor) across departments?
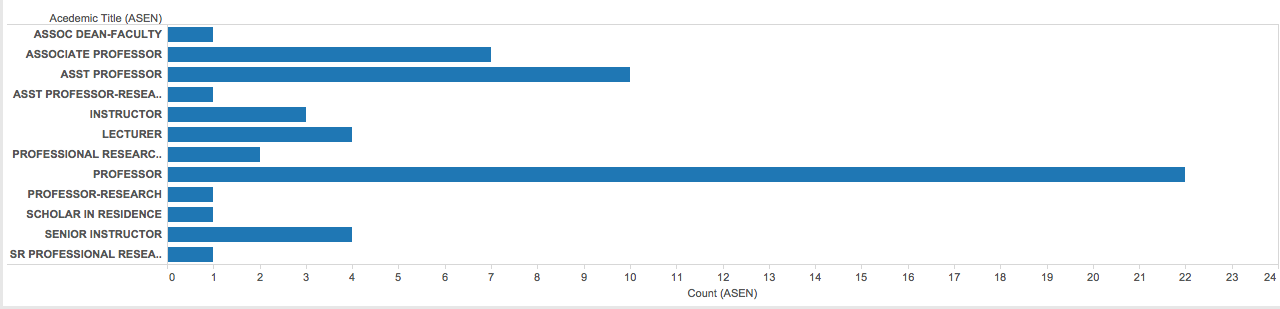 Figure 3-1: Distribution of Academic Title in the ASEN Department
 Figure 3-2: Distribution of Academic Title in the CHEN Department
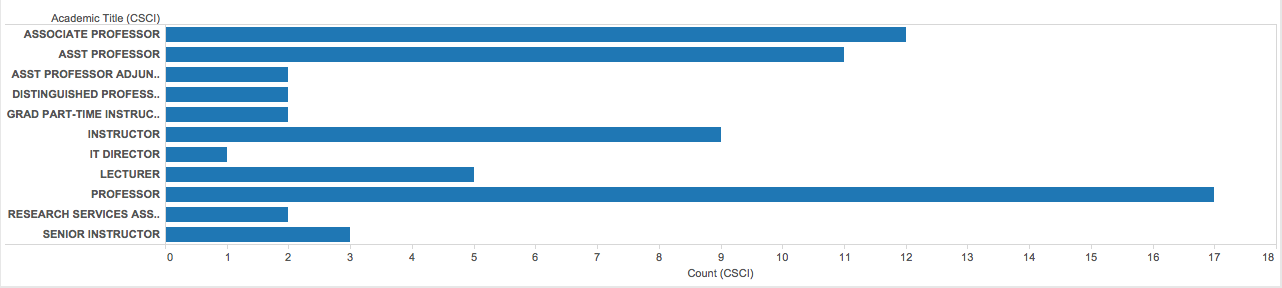 Figure 3-3: Distribution of Academic Title in the CSCI Department
Question 4 [John Murphy]: Which class has the highest rating with the least amount of time spent each week?
/* First, extract all courses with the easiest work load */
var courses = _.groupBy(data, 'Workload.Hrs_Wk')['0-3']

/* Then, find those which have a 4.0 grade, remove duplicates and sort. */
return easy_As = _.unique(_.pluck(_.filter(courses, {'AVG_GRD': 4.0}), 'CourseTitle')).sort()
Table 4-1: Which class has the highest rating with the least amount of time spent each week?
Easy A Courses
Table 4-1: Courses that are easy to get an "A" grade
Question 5 [Andrew Linenfelser]: Which course level has the lowest retention?
 Figure 5-1: Academic division withdrawal rate comparison
(write your explanation for the reader as to where to look at this chart in order to see the answer)